



Workers’ perceptions of the labor market may differ from aggregate labor market statistics. Individuals might be overly optimistic about their chance of finding a job, or too pessimistic about the odds of losing their current position. In this post, we compare subjective beliefs of future job-finding and job-loss from the New York Fed’s Survey of Consumer Expectations (SCE) with their realized counterparts in the Current Population Survey (CPS). We then investigate how closely aggregate perceptions of job-finding and job-loss prospects align with realized rates.
Although job-finding expectations align closely with actual rates before COVID, we document a persistent pessimism following the pandemic, in which newly unemployed workers underestimate their true probability of finding a job. This divergence of expectation from reality is driven by younger individuals and those without a college education. While job separations are more difficult to compare directly, our analysis suggests that expectations exceed true job loss rates, in part due to workers underestimating how drastically layoff rates decrease with longer job tenure.
Are Job Finding Expectations Aligned with True Rates?
The SCE asks employed respondents how likely they would be to find a new job within three months if they were to lose their current job. To create a comparable measure in the CPS, we use microdata that enables us to follow the month-to-month flow of individuals between employment and nonemployment. We examine individuals who are newly unemployed in a given month—namely those who have been without a job and looking for work for four or fewer weeks—and calculate the rate at which these job-seekers become re-employed in the subsequent three months.
Job-Finding Expectations Diverged from Actual Rates After COVID
Three-month job finding rate
Note: Shaded regions indicate U.S. recessions. Six-month moving average applied to both series. The SCE starts in 2013.
The chart above compares the predicted 3-month job finding rates collected by the SCE, which began collecting responses in 2013, with the actual rates we compute in the CPS. Expected and realized rates exhibit similar levels prior to 2020; averaged over 2014 through 2019, the SCE expected 3-month job finding rate is 55.5 percent, in line with the CPS true job finding rate of 57.2 percent over the same period. The steep drop in true three-month-ahead job finding rates at the end of 2019 highlights the unanticipated nature of COVID-19: as individuals did not predict the arrival of the pandemic, expectations only fall at its onset in March of 2020.
However, while actual job finding rates largely seem to recover to pre-COVID levels by 2021, expectations remain subdued for far longer. We document a gap between the two series in the years following 2020, in which worker expectations regarding job finding fall consistently below the realized rate. Although realized job finding rates have stayed at an average of 58.8 percent from 2022 through the present day, predicted job finding probabilities since the pandemic have fallen to 53.0 percent. This wedge suggests that workers have been persistently pessimistic about their chances of finding a job in the post-pandemic period.
Did Job-Finding Expectations Fall Uniformly After COVID?
To determine whether the post-pandemic widening of the gap between job-finding expectations and realized rates was driven by particular types of workers, we compare how the gap changes across age groups and levels of educational attainment. The chart below displays, by demographic group, the difference between expected and true job finding rates averaged across the pre- and post-COVID periods.
Younger Workers and Those Without College Degrees Became More Pessimistic Post-COVID
SCE expected job finding rate minus CPS actual
Note: This chart shows the percentage-point difference between SCE respondents’ expected 3-month job finding rate and the corresponding realized rate computed from the CPS. We calculate this expected-minus-realized gap averaged separately over the pre-COVID (January 2014 through June 2019) and post-COVID (January 2022 through March 2026) periods, overall and by age and educational attainment.
We find that individuals over 30 and those with at least some college education experienced only slight changes following the pandemic in the difference between their expected and true rates of job finding. Before COVID, workers over 30 underestimated their actual job-finding probability by around 5.4 percentage points, while those with at least some college education underestimated it by around 4.6 percentage points. These gaps remain similar after the pandemic, at 6.1 and 4.0 percentage points, respectively. Both groups were already pessimistic before COVID and that pessimism changed little afterward.
However, those aged 30 or younger shifted from an initial optimism, with expected job finding rates 6.3 percentage points higher than the realized data indicates, to pessimism, understating their job-finding prospects after the pandemic by 3.0 percentage points. Before COVID, workers with a high school degree or less held expectations that were, on average, closely aligned with realized job-finding rates. After 2020, this group also becomes pessimistic and in fact exhibits the largest negative gap of 7.5 percentage points between expectations and realized rates.
The post-COVID decline in job-finding expectations relative to the realized job-finding rate appears, then, to be driven primarily by younger workers and those without college degrees. Higher rates of youth unemployment since the pandemic have been a frequent topic of discussion; our research highlights that overly negative perceptions may also contribute to the downbeat labor market outlook of new entrants.
How Do Job-Loss Expectations Compare with Reality?
Unlike the job-finding rate, constructing a CPS measure comparable to the SCE job separation question is less straightforward. The SCE asks workers separately about their probabilities of losing and voluntarily leaving their current job over the next 12 months. By contrast, the CPS follows individuals over four consecutive months and records their employment status in each month. Identifying a separation from employment and classifying it as a layoff versus a quit requires considering not just an individual’s transitions between states but also their reason for leaving a past job.
We construct a simpler measure of job “loss” by identifying employed workers in a given month who leave employment at some point in the subsequent three months and define a job loss as an employment exit where the worker’s first post-employment labor market state is unemployment (without a job and actively seeking work, rather than nonparticipation in the labor force).
We find that workers’ expectations of job loss generally exceed the true job loss rate. As shown in the chart below, the realized job loss probability is about half that elicited from the SCE. This gap does not necessarily imply excessive pessimism. Our CPS measure may miss job losses followed by exits from the labor force, as well as instances in which workers quit before being laid off. Our measure should therefore be viewed as a lower bound of job-loss risk.
Expected Job-Loss Probabilities Consistently Exceed Realized Rates over Time
Three-month job loss rate
Note: The figure compares actual job loss, constructed using flows of individuals from employment to unemployment in the CPS, with expected loss found by converting the SCE’s 12-month expected probability to a 3-month horizon. A three-month moving average is applied to both series. The SCE starts in 2013.
The Gap Between Expected and Realized Job-Loss Widens with Tenure
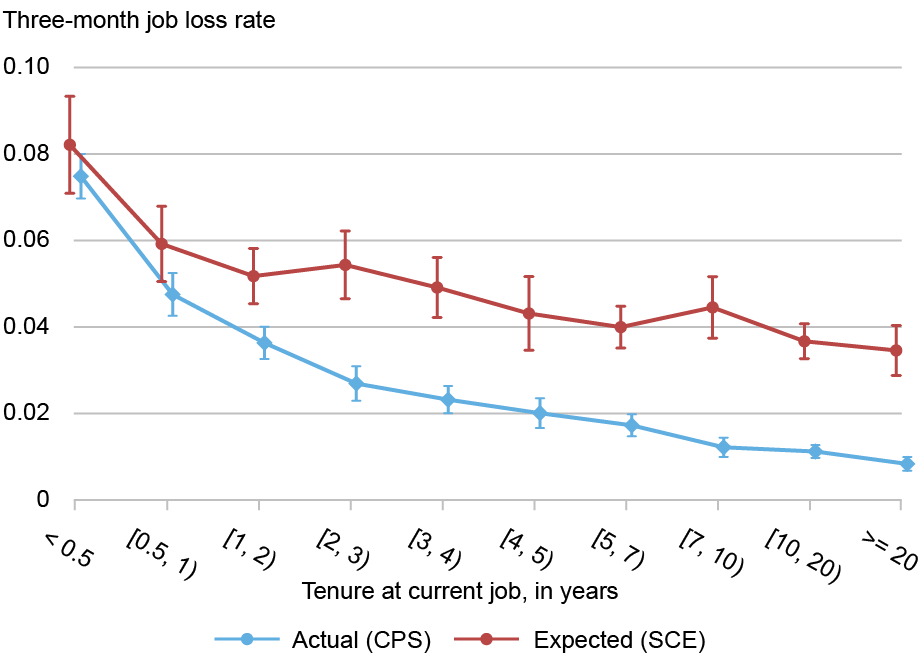
Note: This figure shows how rates of expected and true three-month job loss, constructed as described above, vary with employees’ tenure at their current job, averaged over data from 2014 through 2026. We omit from these averages the pandemic period of mid-2019 to the end of 2021, which saw disproportionately high separation levels.
Prior work has documented considerable person-to-person variation in perceptions about job market risks. To attempt to decompose the overall gap between expected and realized job loss rates, we consider how these job loss probabilities change with worker tenure — how long an employee has been at their current job. For each tenure bin, we plot the expected three-month job-loss probability from the SCE in red, and the corresponding realized rate using the CPS in blue. We find that true job loss rates decrease consistently as tenure at current job increases; this relationship has been documented in the literature, which has shown that after the first few months at a job, the probability of separation declines steadily with increased tenure.
However, the gap between expected and realized job-loss rates widens with tenure: after two years on the job, workers’ expected probability of job loss is more than twice the realized rate. Perceived job-loss risk declines much less sharply with tenure than realized risk does, suggesting that workers underestimate the degree of job security that comes with longer tenure. These findings mirror previous work noting unemployment duration dependence for expected and true job finding rates.
Conclusion
This post explores how worker perceptions of job finding and loss probabilities relate to true rates: do people’s expectations accurately reflect their job market prospects? We document that although aggregate expectations about job finding moved closely with realized rates prior to 2020, workers have been pessimistic about finding a job after a layoff since the pandemic. Furthermore, perceived job loss risk seems to generally overstate the true probability of job loss.
Although the newfound post-pandemic pessimism about job finding prospects appears to be concentrated in younger workers and those without college degrees, the gap between predicted and real job loss rates may derive from workers taking a more cautious view in their expectations of how steeply layoff risk decreases with longer tenure spent at their job.

Richard Audoly is a research economist in the Federal Reserve Bank of New York’s Research and Statistics Group.
Ivy Chen, a former summer intern at the Federal Reserve Bank of New York, is currently a senior at Princeton University.

Miles Guerin is a research analyst in the Federal Reserve Bank of New York’s Research and Statistics Group.

Rachel Schuh is a research economist in the Federal Reserve Bank of New York’s Research and Statistics Group.
How to cite this post:
Richard Audoly, Ivy Chen, Miles Guerin, and Rachel Schuh, “Can Workers Predict Job Finding and Job Loss?,” Federal Reserve Bank of New York Liberty Street Economics, November 16, 2026, https://doi.org/10.59576/lse.20261116
BibTeX: View |
Disclaimer
The views expressed in this post are those of the author(s) and do not necessarily reflect the position of the Federal Reserve Bank of New York or the Federal Reserve System. Any errors or omissions are the responsibility of the author(s).
Source link