

Since World War II, the U.S. economy has experienced twelve recessions—one every sixty-four months, on average. Though infrequent, these contractions can cause considerable pain and disruption, with the unemployment rate rising by at least 2.5 percentage points in each of the past four recessions. Given the consequences of an economic downturn, businesses and households are perennially interested in the near-term probability of a recession. In this post, we describe our research on a related issue: how much uncertainty is there around recession probability estimates from economic models?
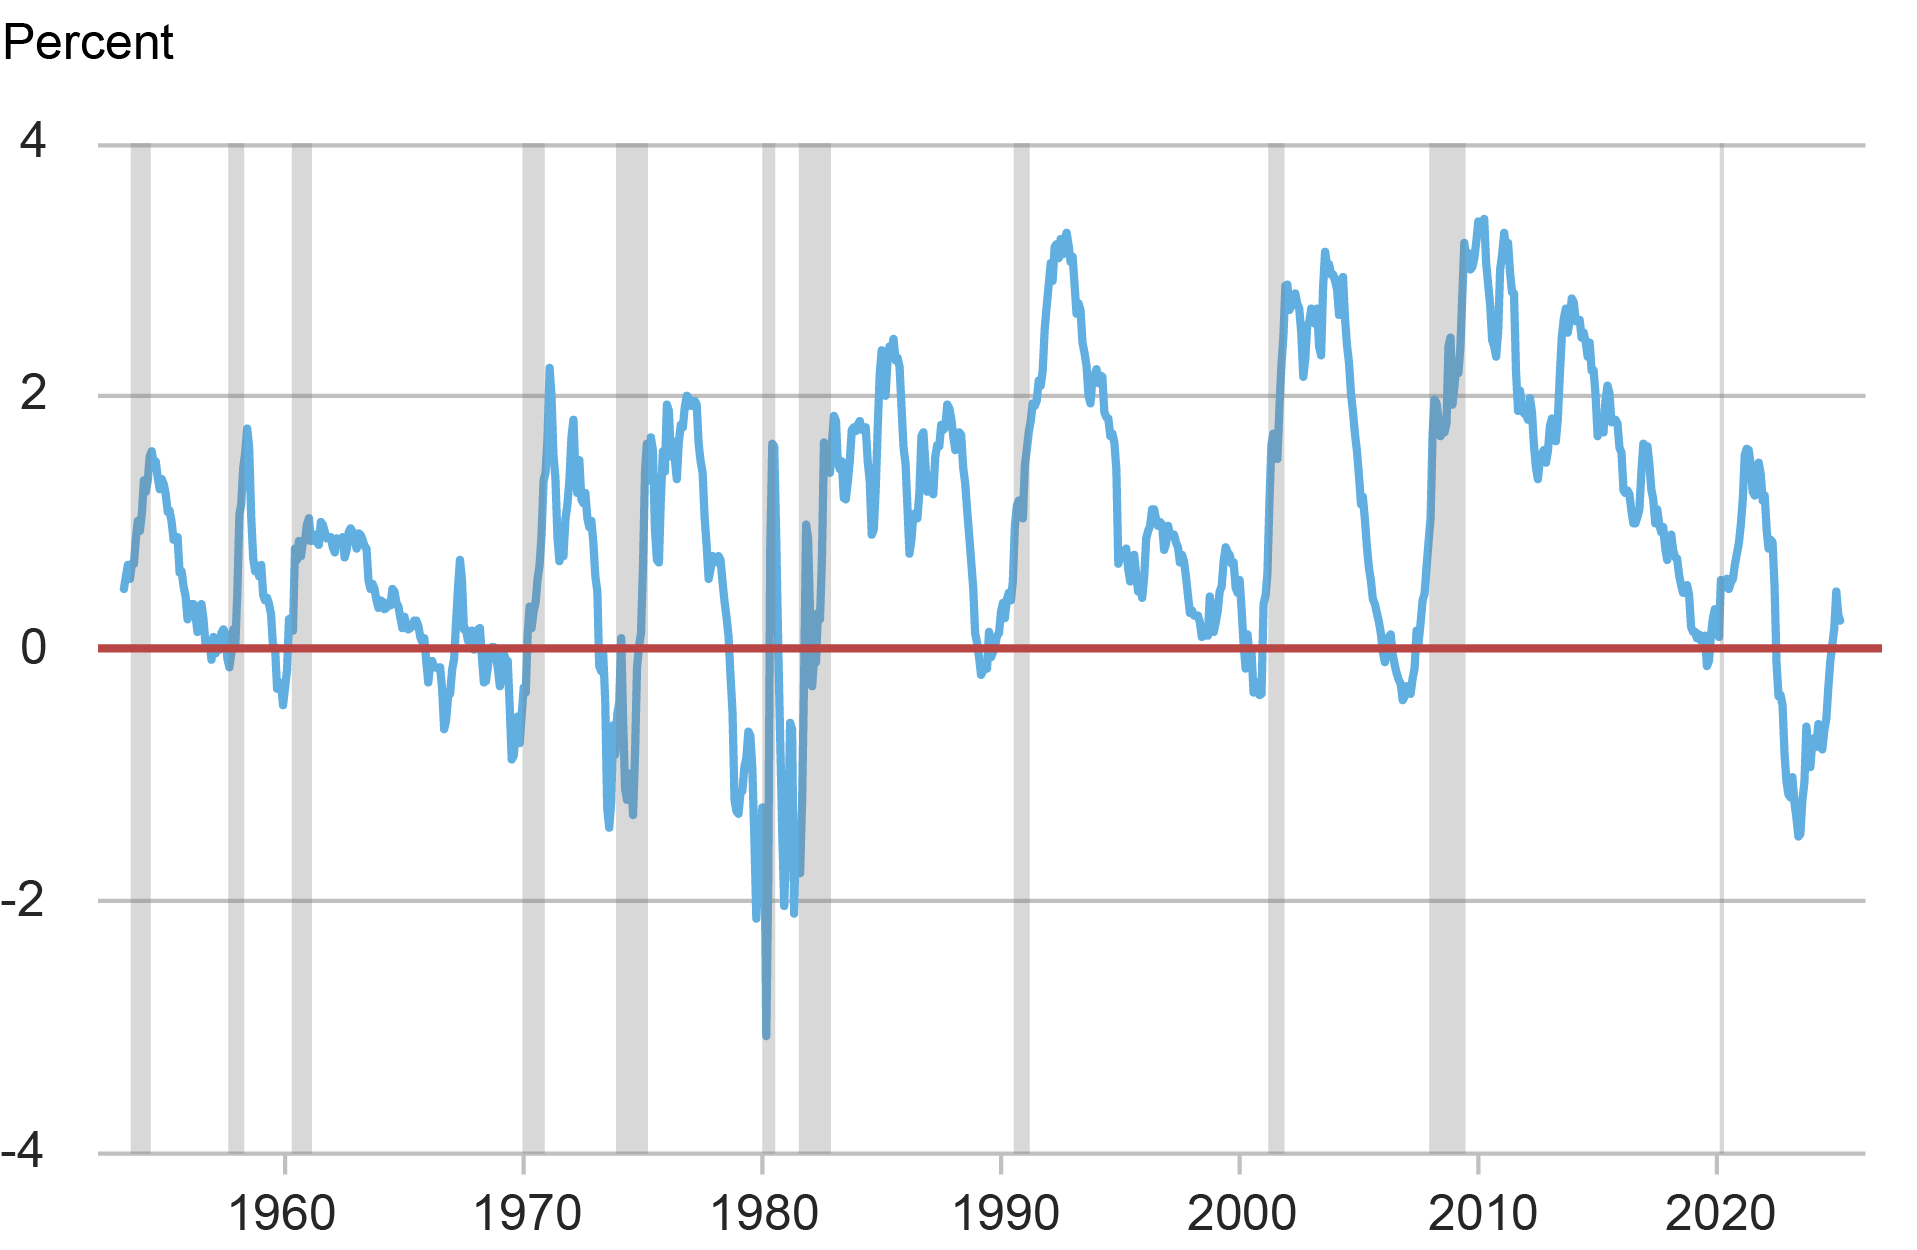
In the United States, a number of predictive models for recessions rely on information from the term structure of interest rates based on Treasury bonds. In particular, the term spread—the difference between a long-maturity yield and a short-maturity yield—has had an unparalleled track record of predicting U.S. recessions since the 1950s. The chart below shows the time series of the ten-year yield less the one-year yield over this period. The grey bars in the chart denote NBER-defined recessions. We can clearly observe that this measure of the term spread declines below zero (horizontal red line in graph) before every recession and only rarely takes on these levels without a subsequent recession.
The Term Spread over the Past Seventy Years
The standard way to formalize this observation (see, for example, the New York Fed’s Yield Curve as a Leading Indicator) is through an estimate of a relation of the form

where![]() and
and ![]() are numbers estimated from the data and
are numbers estimated from the data and ![]() is a specific choice of function that maps any value to a new value between zero and one.
is a specific choice of function that maps any value to a new value between zero and one.
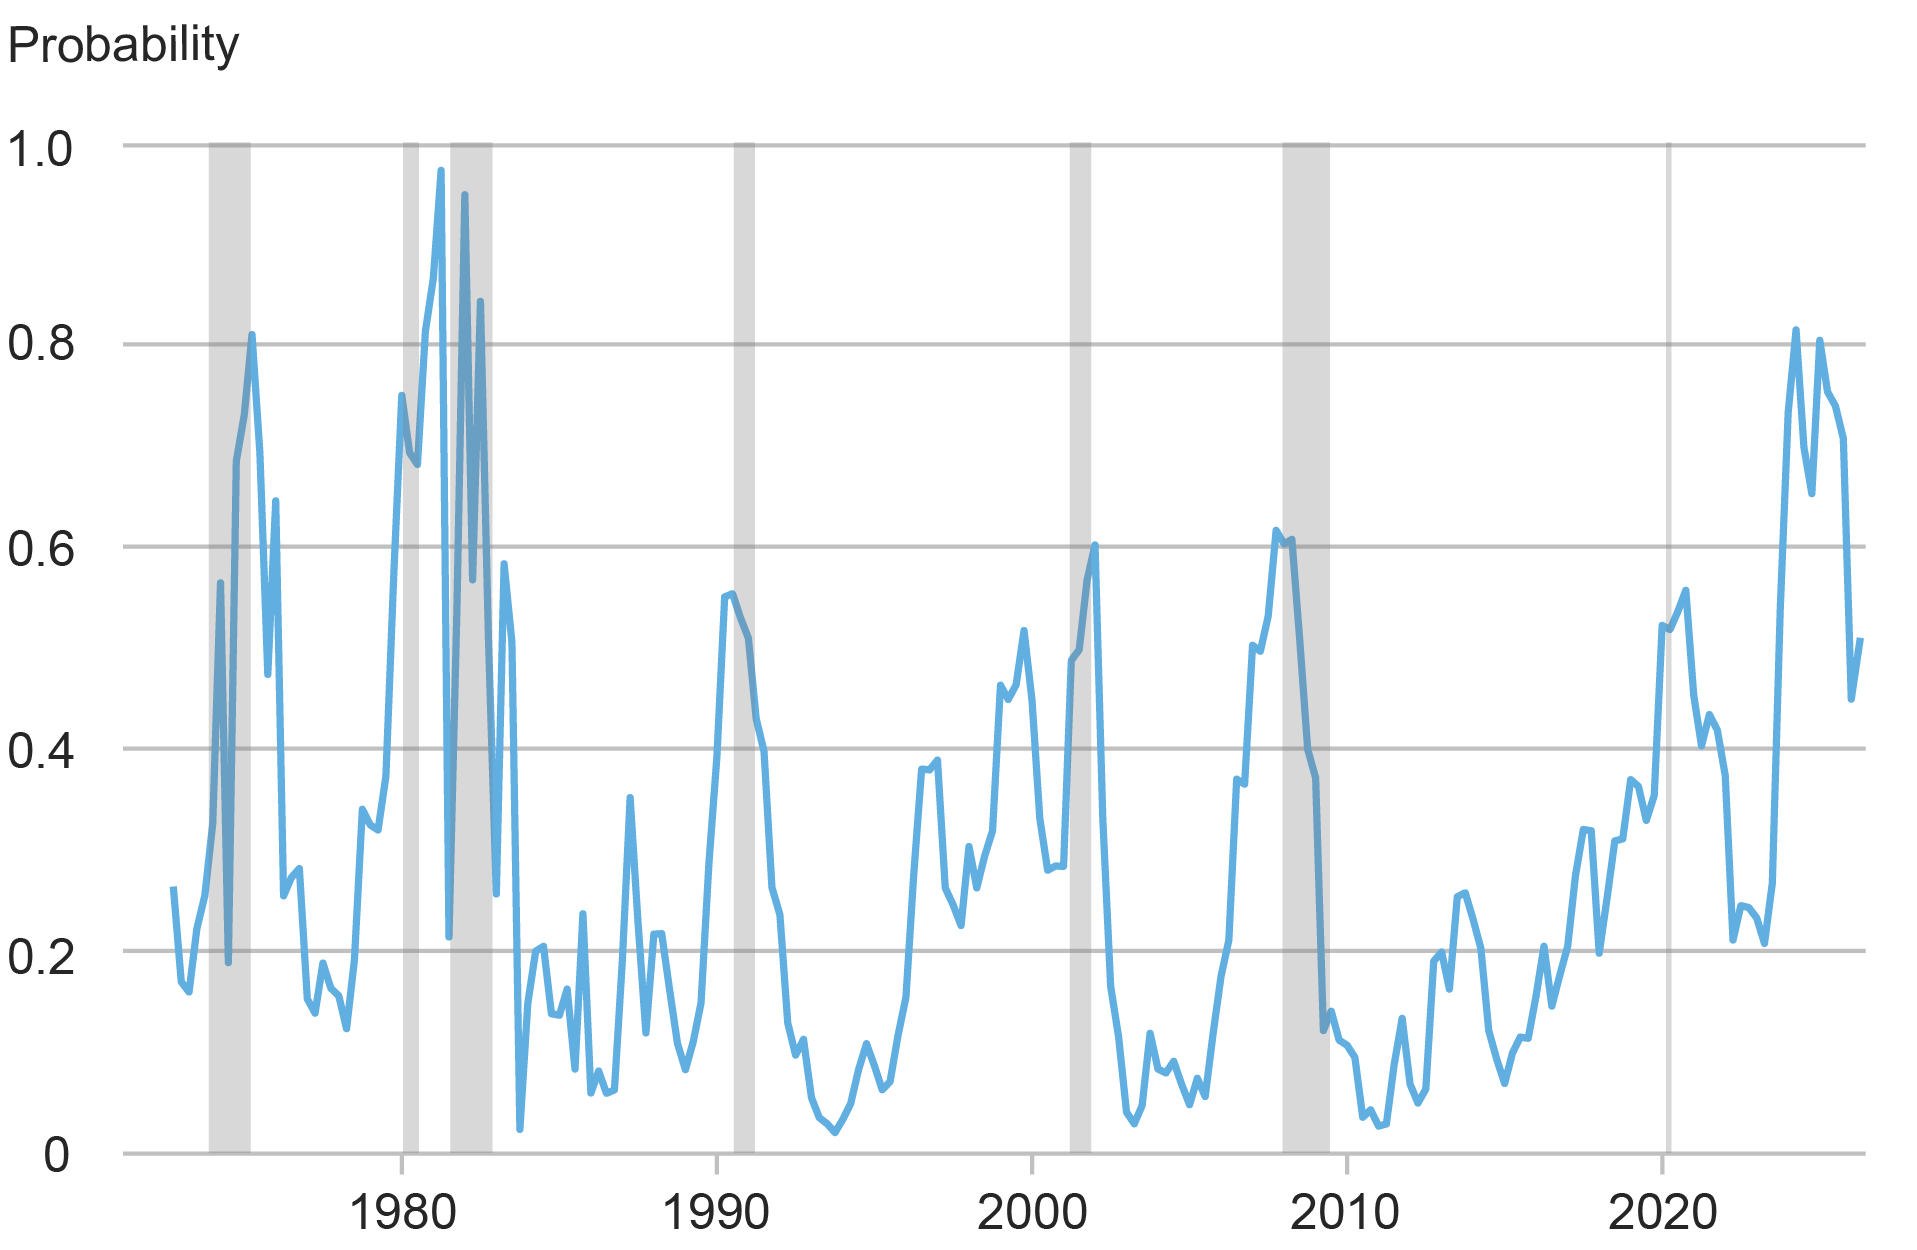
The next chart shows the probability of a U.S. recession starting within a year over the more recent sample from 1972 to 2025. We choose this sample period because of the availability of data for the full term structure of interest rates. As shown, the estimated probability of a near-term recession rises comfortably above 50 percent in the run-up to each recession, exhibiting the forecasting power of the term spread. It should be noted that this estimate is not an official New York Fed forecast. Moreover, it’s important to remember that this is just an estimate of the probability of recession from one model. All estimates have a certain degree of uncertainty surrounding them. In this case, the infrequency of recessions exacerbates that uncertainty. But then how uncertain are these estimates—and how can we quantify this uncertainty?
Estimated Recession Probabilities Have Exceeded 50 Percent Leading into Past Recessions
In a recent paper, we introduce a new way to capture uncertainty when working with yield curve data. In particular, we introduce a special method to reshuffle the data (a rotated “block bootstrap” in statistics jargon) in order to generate alternative paths of yields that mimic the properties of observed yields over the sample period. Our approach does not take a stand on how the data were generated (that is, on which model is “correct”) and uses economic relationships and identities to reshuffle the data in an internally consistent manner that preserves the structure across different yield maturities. This enables our procedure to be robust to the changing structure of the economy and financial markets through the signals coming from the term structure of interest rates.
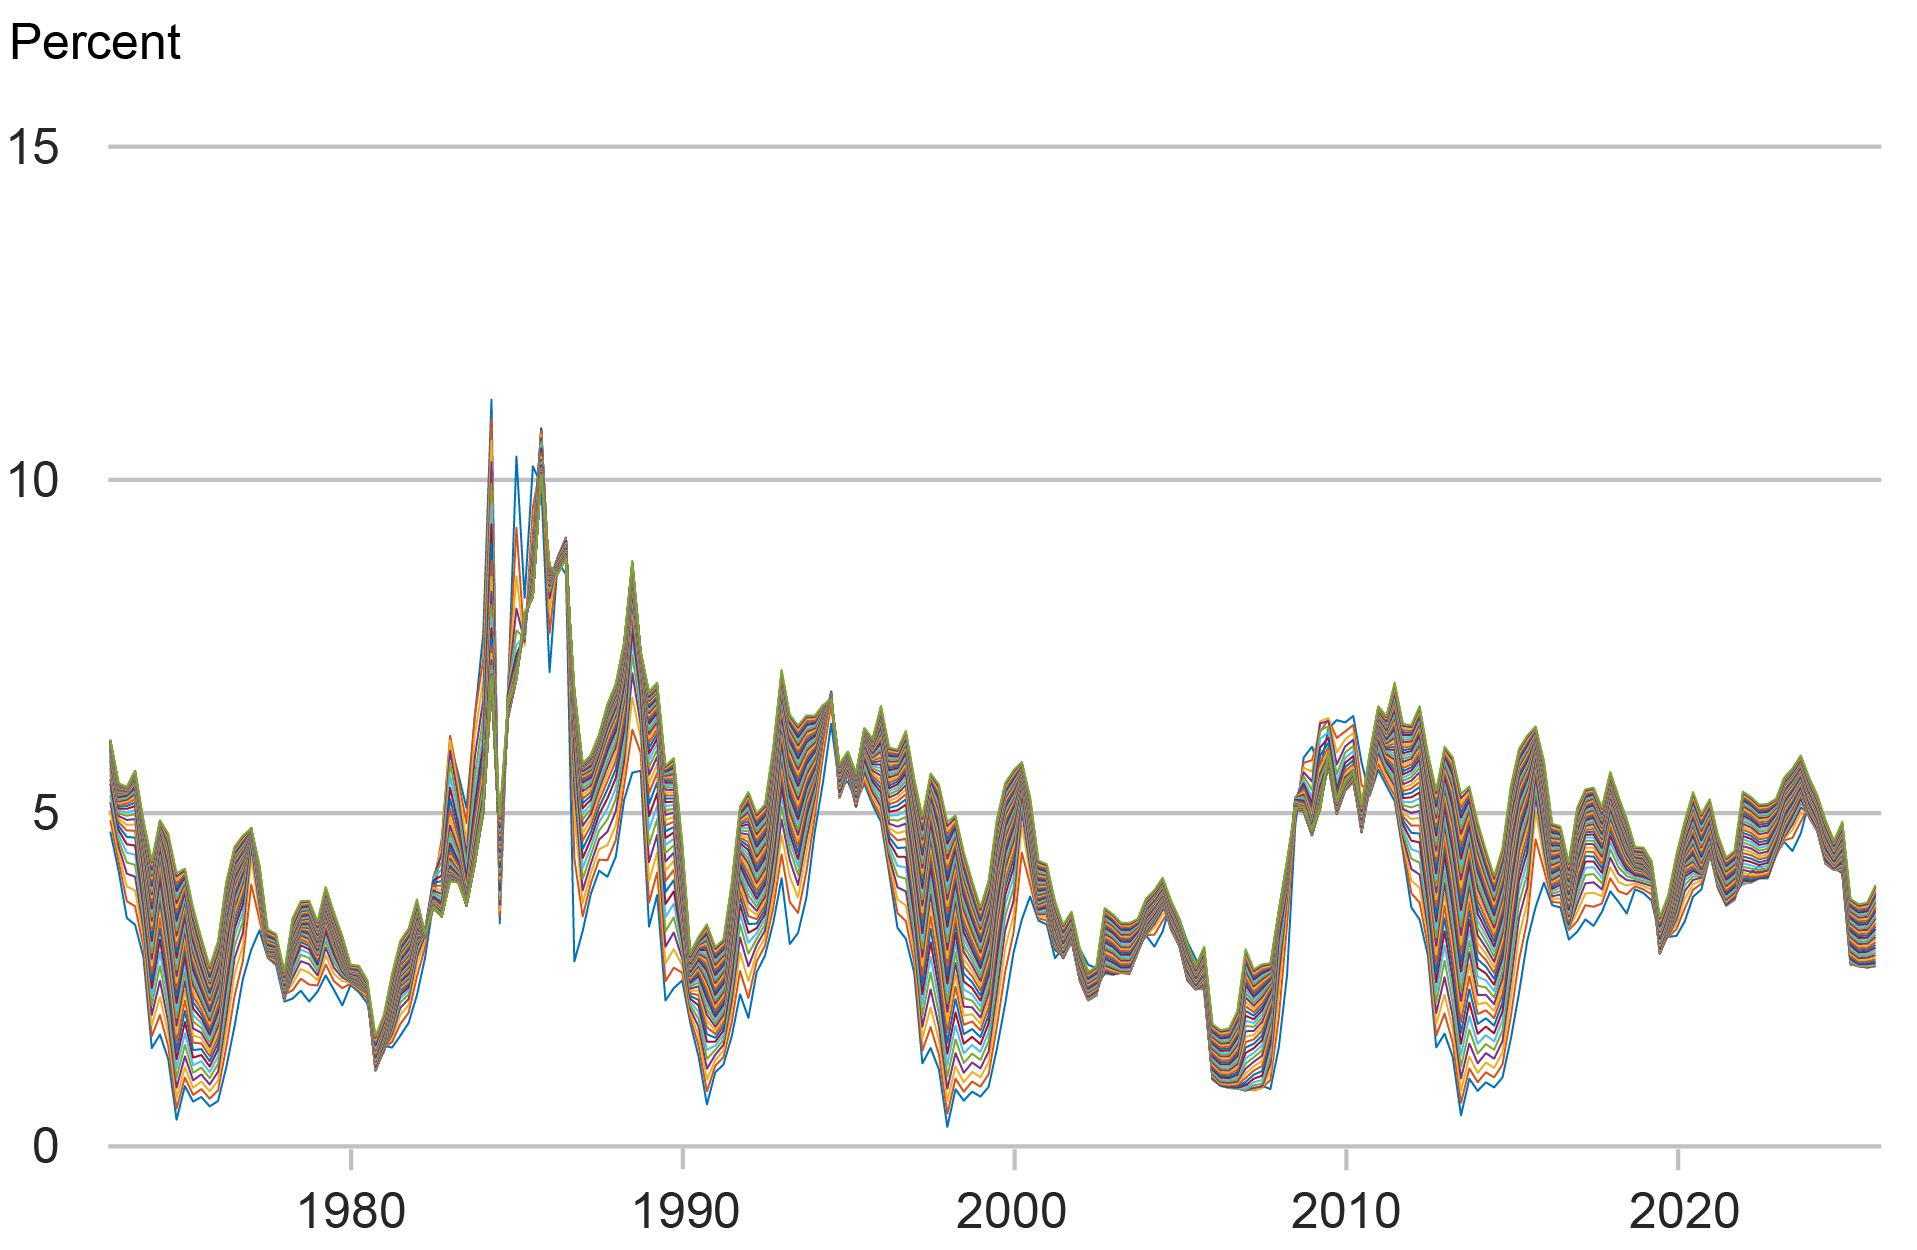
The chart below shows the actual data in the top panel, along with a single alternative “bootstrap draw” in the bottom panel. As we can see, the key features of yields are replicated in the bottom plot even if these alternative values may be very far from the values that we actually observe. This includes the “factor structure”—a reference to the joint co-movement across yields—which is reflected in the sedimentary rock-like pattern in the data. In this alternative state of the world, the highest interest rates occurred in the late 1980s and the average level of interest rates at the end of the sample is more than 1 percentage point lower than the actual level of interest rates.
Key Features of the Actual Term Structure of Interest Rates…

…Are Replicated in Each Bootstrapped Sample
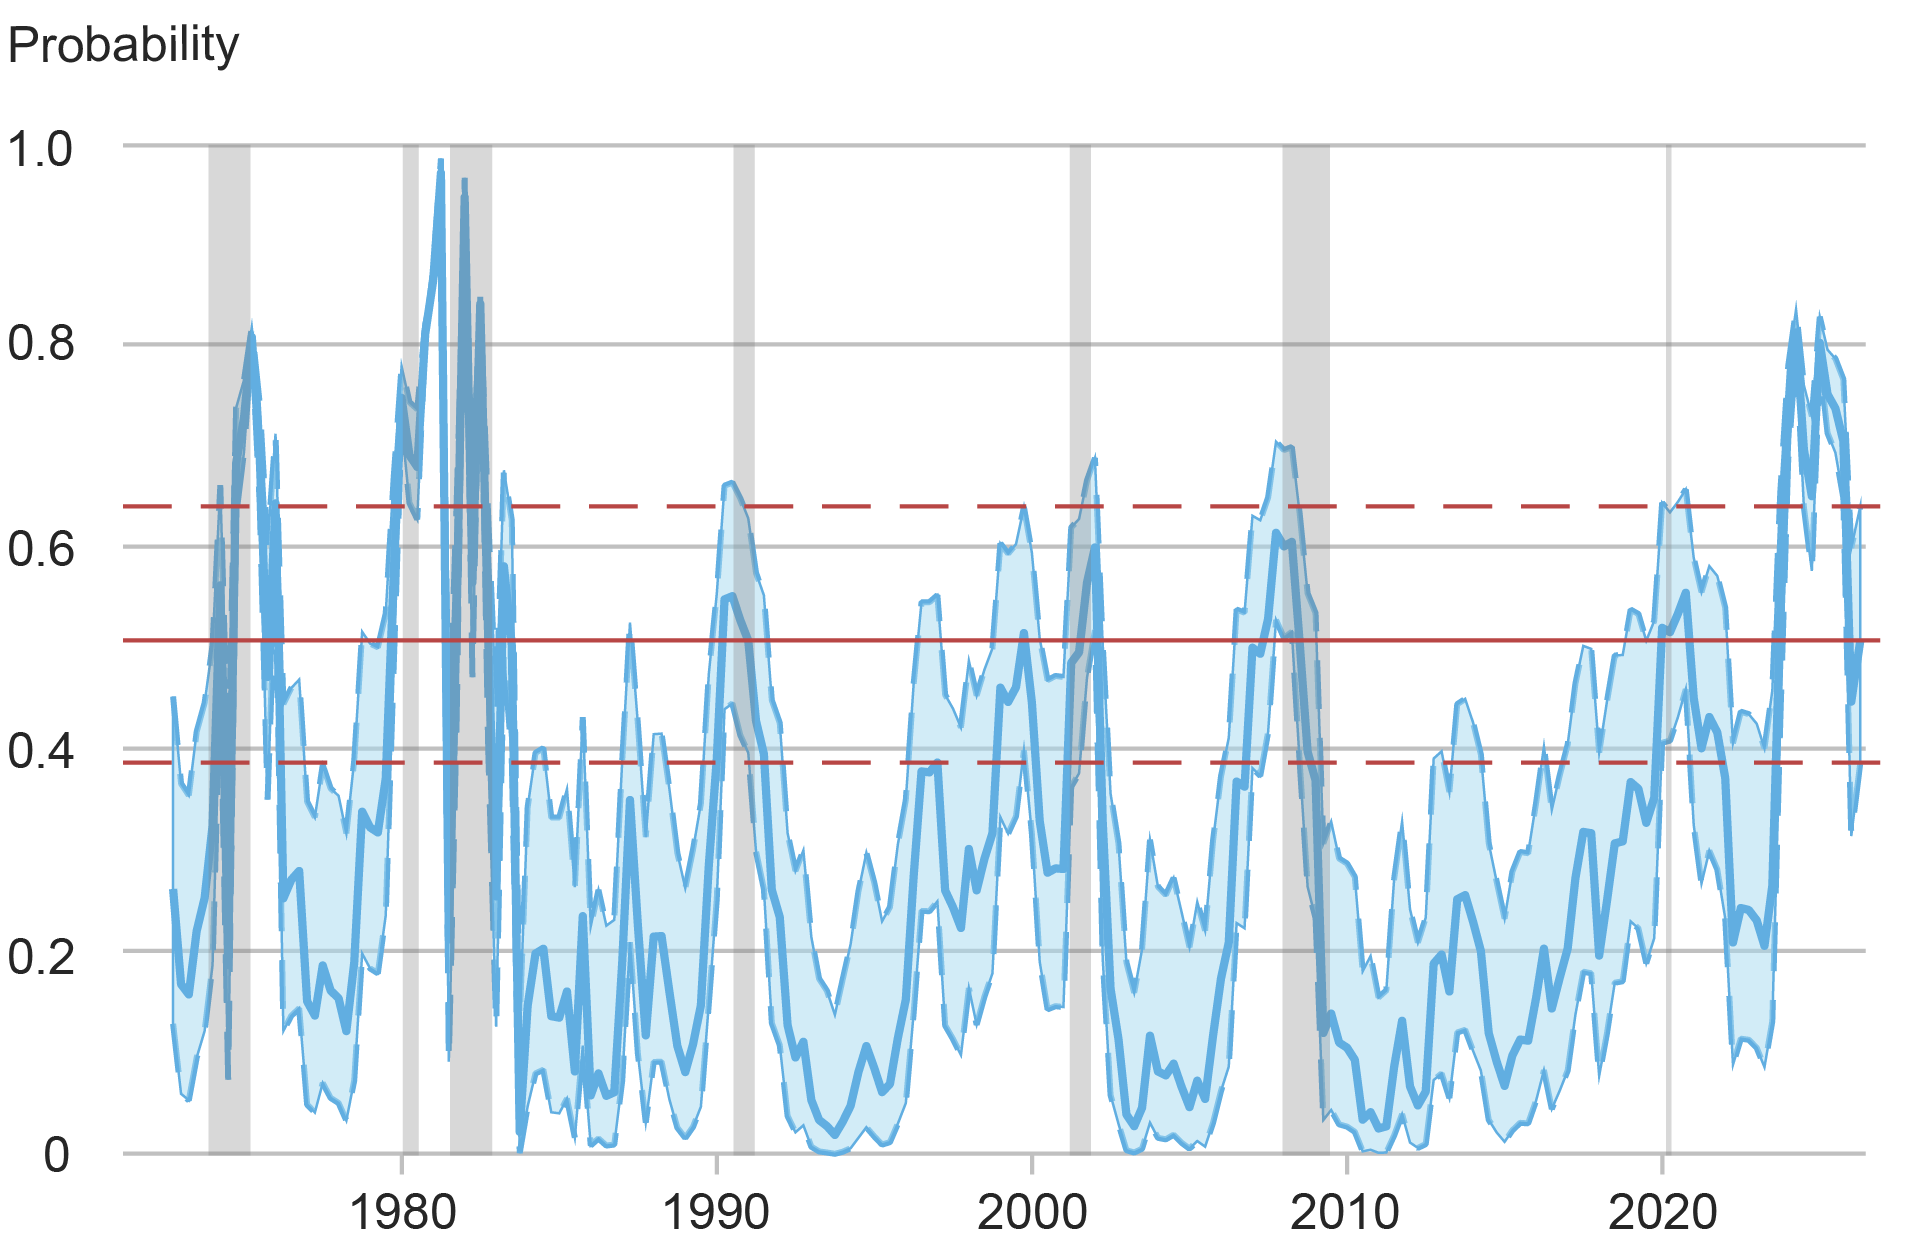
Our method enables us to generate many of these alternative paths (along with alternative paths for real output growth) and re-estimate the probability of a recession starting within one year a number of times. The chart below shows how 68 percent of the estimates of this probability move around with 999 of these estimated paths (see Section 3.3 in the paper for full details). We can first observe that the bands (light blue shading) around the estimated probability (solid blue line) can be quite wide and tend to narrow when the estimated probability is higher. At the end of the sample—April 15, 2025—the estimated probability is about 51 percent, with a 68 percent confidence interval of 39 to 64 percent, which is denoted by the horizontal red lines.
There Is Considerable Uncertainty about the Estimated Probability of Recession
In our paper, we also estimate a modified model that, along with the term spread, includes as a predictor the deviation of the three-month yield from its three-year moving average (see also Wright, 2006). This extra predictor provides additional information about recent economic and financial activity through the lens of the yield curve. In particular, it provides information about whether movements in the term spread are primarily driven by movements in the longer-maturity yield or the short-maturity yield. The new specification adds this predictor (“Dev”) as:

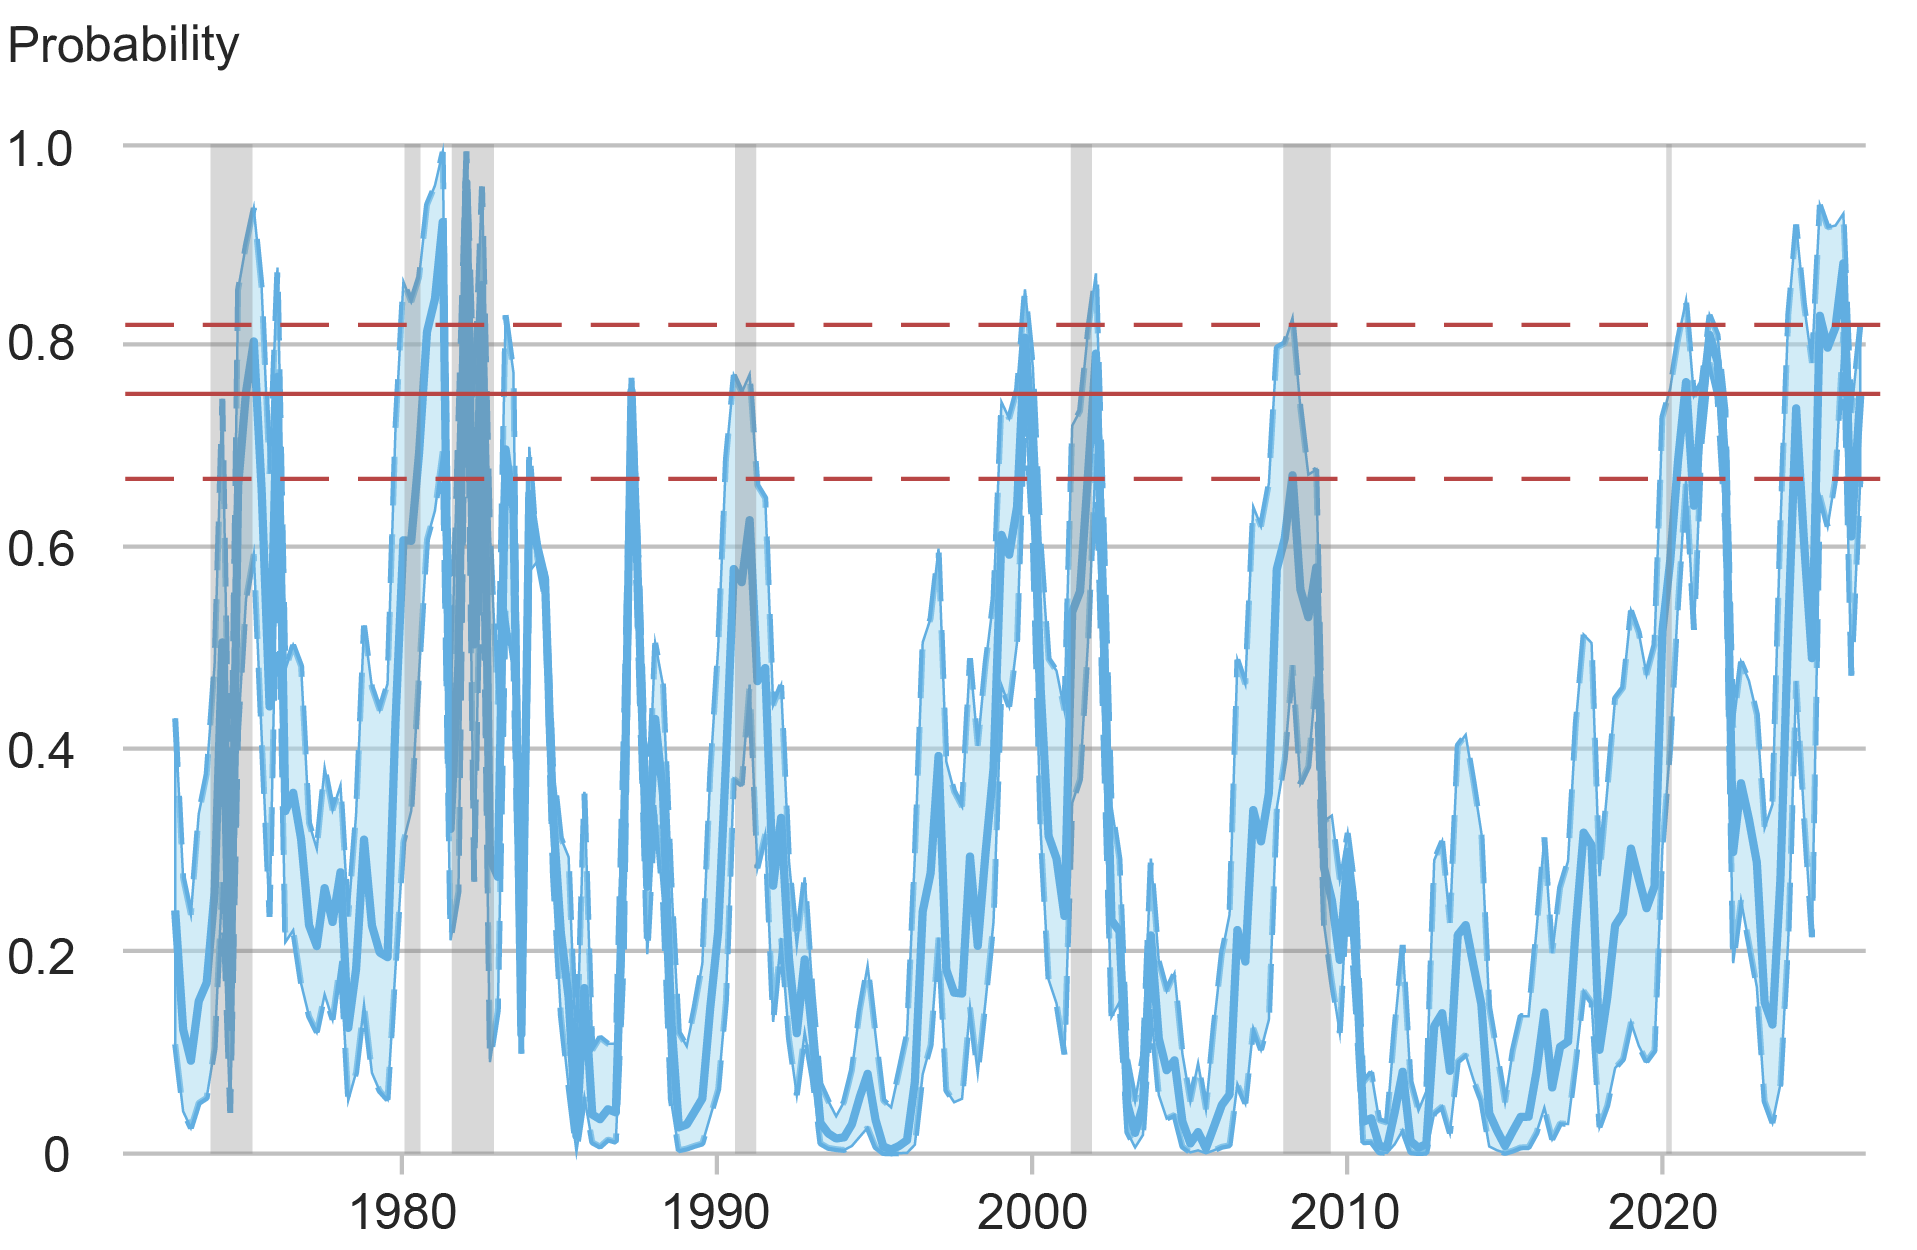
The chart below shows the estimated probability from the modified model (solid blue line) along with a quantification of uncertainty (light blue shading). For this model we can observe that around past recessions the estimated probability is higher than that produced by the simpler model. The modified model’s current estimated probability is 75 percent with a 68 percent confidence interval of 67 to 82 percent (shown with horizontal red lines). This estimate—which, again, is not an official New York Fed forecast—is down from an estimate of 83 percent about eighteen months ago but remains high by historical standards. Furthermore, the degree of uncertainty is currently below the historical average.
Uncertainty about the Current Probability of Recession Is Lower than the Historical Norm

Richard K. Crump is a financial research advisor in the Federal Reserve Bank of New York’s Research and Statistics Group.
Nikolay Gospodinov is a research economist and senior adviser on the financial markets team in the research department at the Federal Reserve Bank of Atlanta.
How to cite this post:
Richard Crump and Nikolay Gospodinov, “How Uncertain Is the Estimated Probability of a Future Recession? ,” Federal Reserve Bank of New York Liberty Street Economics, May 29, 2025, https://libertystreeteconomics.newyorkfed.org/2025/05/how-uncertain-is-the-estimated-probability-of-a-future-recession/.
Disclaimer
The views expressed in this post are those of the author(s) and do not necessarily reflect the position of the Federal Reserve Bank of New York or the Federal Reserve System. Any errors or omissions are the responsibility of the author(s).
Source link