
The S&P 500 on Friday was once again trading above its last record close notched over two years ago, setting its new intraday record high after wobbling in a narrow trading range for almost a month.
The large-cap benchmark S&P 500 index
SPX
traded as high as 4,826.91 on Friday, topping its intraday record high of 4,818.62 set on Jan. 4, 2022. The index is also on pace to end above its record-closing high of 4,796.56 set on Jan. 3, 2022, according to FactSet data.
The move comes amid a choppy start to the year for stocks that analysts have attributed to a renewed rise in Treasury yields and uncertainty over a March interest-rate cut by the Federal Reserve.
Friday also marks the 513th day since the last record closing high for the S&P 500. If the index ends above the record close on Friday, that would end the longest stretch without an all-time closing high since the 1,375 trading-day streak from October 2007 to March 2013, according to Dow Jones Market Data (see table below).
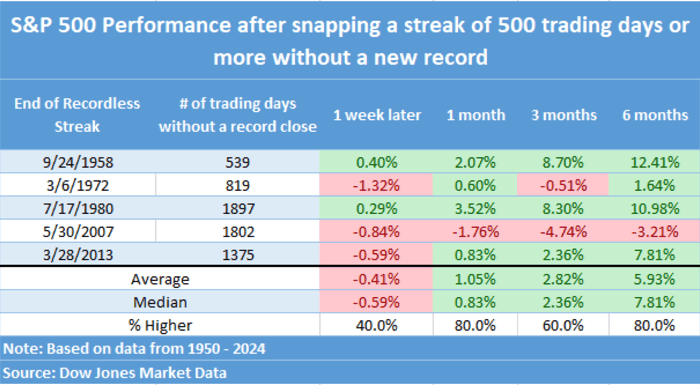
SOURCE: DOW JONES MARKET DATA
U.S. stocks opened the new year on a downward trend, pulling back from near-record highs as solid economic data and pushback from Federal Reserve officials against market expectations of aggressive rate cuts maintained a cloud of uncertainty over the path of monetary policy in 2024, while driving the longer-term Treasury yields to their highest levels since December.
The S&P 500 index has remained in a short-term trading range which has been in place since mid-December. The range is bound by the intraday level of around 4,700 on the downside and the intraday level of a little above 4,800 on the upside for the past month, but the S&P 500 never scored a close above the record-high of 4,796.56 over that period, according to FactSet data.
However, stocks posted a solid recovery Thursday as an upbeat 2024 outlook by chip maker Taiwan Semiconductor Manufacturing Co.
TSM,
drove an outperformance from megacap technology stocks that saw the S&P 500 and the Nasdaq Composite
COMP
erase all their 2024 losses.
Mark Arbeter, president of Arbeter Investments LLC, said he hasn’t seen any short-term technical damage to the major indexes as “they are all working on bearish daily momentum divergences” from extreme overbought territory at the end of 2023, when the stock-market sentiment “was rip roaringly bullish.”
But he also saw technical evidence continue to mount for “some type of pullback or correction” with some major indexes at, or near their all-time highs. “There are plenty of more obscure indicators that do not line up for the bulls,” Arbeter said in a Thursday client note.
For example, the VIX term structure, which compares one-month futures
VX.1,
on the Cboe Volatility Index
VIX
to the three-month VIX futures
VXJ24,
and shows expectations of future implied volatility of the S&P 500, is in backwardation.
That means futures traders are pricing in lower near-term volatility suggesting there is complacency in the market that often leads to trouble, Arbeter wrote. “At times, this indicator can be early but is pretty accurate in seeing trouble ahead,” he said.
Meanwhile, historical data shows that a return to record territory after a gap of at least a year has led to positive returns a year later, noted strategists Ed Clissold and London Stockton of Ned Davis Research.
“Did the rally to new highs leave the market overbought and in need of a correction? Or was it a breakout to a new up leg? History sides with the latter,” wrote Clissold and Stockton, in a December client note.
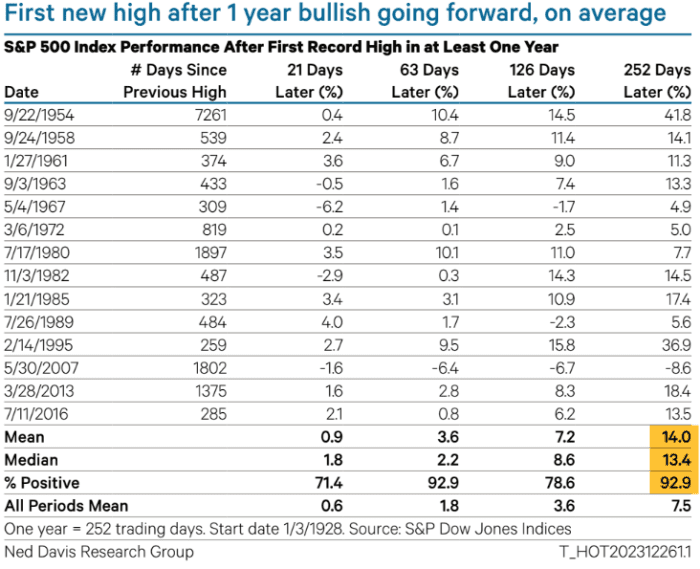
SOURCE: NED DAVIS RESEARCH GROUP
U.S. stocks were higher on Friday with the S&P 500 up 23 points, or 0.5%, to trade at 4,803.93, while the Dow Jones Industrial Average
DJIA
was rising 150 points, or 0.4%, and the Nasdaq Composite was advancing 0.6%, according to FactSet data.
—William Watts contributed.
Source link